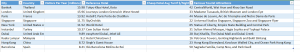
Someone on Twitter posted a link to an infographic on the 10 most visited cities in the world, which you can see below. I’m interested in travel, and I like data, so I looked through it.

After a second or two of looking at it, my BI and dataviz nerdiness kicked in. Here were my thoughts:
- I know infographics are cool, and I love that they communicate an interesting data point to the general public in an easily consumable manner. But I hate when they make them really large/long with a lot of text where you have to read through every bit of text to really get the info. You lose a lot of the opportunities for preattentive processing with a format like this.
- I know I could make a great Power View from this data that could deliver information more efficiently, and I think it would look pretty cool.
Making the Power View
First, I had to get the data and put it in a Power Pivot model. I just copied the info from the infographic and put it in a single table in Excel. You could split it out and put it into several tables (especially if you split the tourist attractions into 3 individual fields per city), but I didn’t need it for what I was making and the data was all at the same level of granularity in my single table.
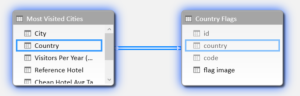
I imported that into my Power Pivot model by selecting the table and clicking the Add to Data Model button on the PowerPivot tab. I had a vision of where I was going with my Power View, so I also imported a table of countries and flag images into Power Pivot. See yesterday’s post for info on how to import images into Power Pivot. I had originally split out the hotel price and the hotel name as two separate fields, but I found that I liked them together when I was building my Power View so I made a calculated field in Power Pivot to take care of that. Here are my tables in Power Pivot:


You’ll notice on the Country Flags table, I had to change the table behavior properties to get the images to render properly in Power View. You can find this on the Advanced tab in Power Pivot. The important part is to set the default image to the flag image. Next I had to relate my most visited cities data to the appropriate flag. Since there is one row per country in my Country Flags table, this was as easy as relating the country field in the Most Visited Cities table to the country field in the Country Flags table.
And finally, I built my report. You can download my workbook here.

I used a map and cards to display the data. In the map, the bubble size represents number of visits. If you click on a bubble you filter the table below to see just the information for that location. If you hover over a bubble you can see the city name and visits per year. The table is sorted by visitors per year descending.
Why I Like This Power View
Let’s try an experiment: open the file in Excel and then open the infographic in your browser. See how long it takes you to answer the following questions with the infographic and then with the Power View.
- How many of the most visited cities are in the United States?
- If I were to plan a trip to visit 3 of the cities on this list, which ones would be most convenient to visit in one trip?
- What tourist attractions are in Hong Kong?
- How many visitors does Dubai get per year?
- In what country is Kuala Lumpur located? (I’m hoping you know this off the top of your head, but let’s pretend you need to look it up.)
- Which country has the lowest average hotel rate?
I think the Power View would answer all of these questions quicker or just as quick as the infographic. If you have been looking at the infographic for a while, you might be pretty fast at #3, #4, and #5. But you will be much slower at #1, #2, and #6 using the infographic.
There are two main reasons for this:
- The map provides visual information that you can take in quickly. You can quickly see locations of these cities on the globe as well as their locations relative to each other. Because of preattentive processing (PDF) we can determine which places have the most visitors (size), which places are close to one another (spatial position), and where cities are located (color – the mauve bubbles stand out) without having to really think about it. I will note that both the Power View and the infographic do a good job of using enclosure to indicate which data points are related. The Power View has the mauve bars to the left and the line above to separate each city. I easily know that Malaysia is the country related to Kuala Lumpur and don’t confuse it with the information for Hong Kong above it.
- Interactivity allows us to quickly find information through sorting and filtering. For question #3, I just clicked on the bubble for Hong Kong to filter the table below and find that the tourist attractions in Hong Kong include Hong Kong Disneyland, Kowloon Walled City, and Ocean park Hong Kong. To find the lowest hotel rate, I just sorted my table by the Avg Cheap Hotel field ascending and looked in the first card to find Kuala Lumpur has hotels for $16. If you look for this information in the infographic you have to scan through every box until you find Hong Kong or look through all the boxes and remember the lowest hotel rate you have read.
Perhaps you think that it is unfair to compare an interactive Power View with a static infographic. I would argue that it makes a point. When you build BI solutions including reports and ad hoc data discovery tools you should consider the needs of the end consumer to decide whether you need interactivity. They do make interactive infographics. This author chose not to include that feature in her design. There are some advantages to the infographic around accessibility. The infographic can render in basically any browser on any device and can be downloaded as an image to where it doesn’t require internet connectivity. Power View maps currently use Silverlight and the maps require an internet connection. The preview of Power BI in Office 365 has an HTML view but it doesn’t yet work with maps, so you aren’t going to look at this Power View on an Android or iOS device.
I don’t think all infographics are inherently poorly designed; I don’t think this one is particularly bad. I do think that the information could be better arranged to more effectively communicate to the audience. I recommend looking through Stephen Few’s presentation on Infographics and the Brain (PDF) for more info on this subject. I agree with Few that infographics are good when they simplify the data and tell a story to communicate a message with the data in addition to being entertaining.